How Blooma and CompStak Empower Smarter Lending Decisions
In the ever-evolving world of commercial real estate (CRE), having the right insights can mean the difference between a successful investment and a costly misstep. As market volatility continues to challenge CRE lenders, making informed decisions is more critical than ever. That’s why we created the CRE Market Movers series in partnership with CompStak—to deliver the data and insights lenders need to make quick, confident decisions.
In this guide, we explore the top markets with the highest average sales price per square foot for industrial properties. CompStak’s robust market data combined with Blooma’s cash flow analysis provides a comprehensive toolkit for understanding market stability and investment potential. Let’s break down the data, why it matters, and how you can use these insights to reduce risk and drive smarter lending decisions.
The Data: Top Industrial Markets by Sales Price Per Square Foot
Over the past year (Q4 2023 - Q3 2024), the following markets emerged as the leaders in average sales price per square foot for industrial properties. Unsurprisingly, markets near major ports and population hubs dominated the rankings, driven by strong demand, limited supply, and significant rent growth since pre-COVID.

These numbers tell an important story about market dynamics, stability, and opportunity. But to truly understand what they mean for your investment strategy, we need to dig deeper into the factors driving these trends.
Why Sales Price Insights Matter
Understanding Market Stability
In CRE lending, market stability is key. High sales prices often indicate strong demand, low vacancy rates, and confidence in the market’s growth potential. Conversely, lower sales prices may signal weaker demand or oversupply, posing a higher risk of vacancies and defaults.
CompStak’s data provides a clear picture of where demand is thriving and where caution may be warranted. For instance:
- Los Angeles - Orange - Inland Empire leads the pack with a staggering $293.38 per square foot. This market benefits from proximity to the ports of Los Angeles and Long Beach—two of the busiest ports in the nation. The combination of logistics demand, limited land availability, and strong population growth drives prices higher.
- New Jersey (North & Central), at $157.42 per square foot, reflects the enduring strength of the New York metropolitan area. The port of New York and New Jersey supports robust industrial activity, and proximity to one of the largest consumer markets in the U.S. keeps demand high.
- Dallas-Ft. Worth, with $147.23 per square foot, highlights the region’s appeal as a logistics hub. The area’s central location, transportation infrastructure, and business-friendly environment attract both investors and tenants.
Understanding these price trends helps lenders reduce the risk of investing in markets that may face future instability.
Reducing Risk in a Volatile Market
Knowledge of sales prices is directly linked to risk mitigation. Markets with high sales prices often have low vacancy rates and strong rent growth—indicators of stability. By focusing on these markets, lenders can reduce the risk of defaults and vacancies.
For example, investing in industrial properties in Los Angeles or New Jersey offers a higher probability of steady returns compared to markets with lower sales prices, like Houston ($83.41 per square foot). While Houston offers opportunities, the lower pricing may reflect higher supply levels or weaker demand, warranting a more cautious approach.
The Power of Blooma and CompStak Together
1. Pinpoint Market Trends with CompStak Data
CompStak’s comprehensive market data offers granular insights into lease and sale prices and detailed property data across key markets. This data helps lenders:
- Benchmark Deals: Compare potential investments to market averages to avoid overpaying or missing undervalued opportunities.
- Identify Trends: Understand where demand is growing or shrinking to anticipate future market shifts.
- Assess Stability: High sales prices and low vacancy rates are strong indicators of market stability.
2. Analyze Cash Flow with Blooma
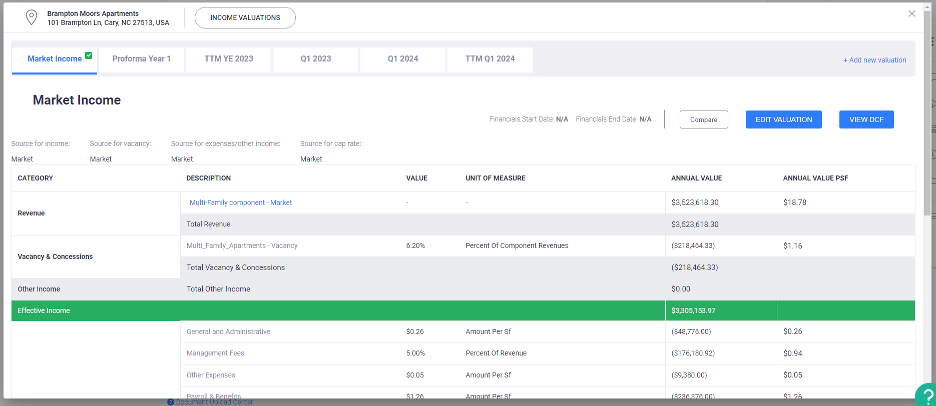
Blooma takes the guesswork out of cash flow analysis by transforming dense financial data into actionable insights. When lenders upload Profit & Loss (P&L) documents, Blooma’s AI-powered platform:
- Parses Data Automatically: Extracts key financial metrics without manual effort.
- Creates Proforma Scenarios: Test different financial outcomes based on CompStak’s market data.
- Identifies Risks and Opportunities: Quickly spot red flags or potential growth areas within your portfolio.
Together, these tools streamline the lending process, enabling faster, more confident decision-making.
Practical Applications for Lenders
1. Informed Due Diligence
When evaluating new deals, combining Blooma’s cash flow analysis with CompStak’s real market data ensures you’re making decisions based on actual insights. For instance, if a property in Dallas-Ft. Worth is priced above the market average, it might be overvalued. Conversely, if it’s below average, it could be a hidden gem.
2. Portfolio Management
Markets are constantly shifting. By continuously monitoring market conditions, lenders can adapt their strategies. If CompStak data shows declining sales prices in a market where you hold assets, Blooma can help reassess the cash flow projections and determine whether to hold, sell, or reposition those assets.
3. Creating Proforma Scenarios
Blooma’s proforma capabilities allow lenders to model different scenarios quickly and efficiently. Using CompStak’s rent data, you can:
- Project Future Cash Flows: Based on current market conditions.
- Evaluate Multiple Scenarios: Without manual calculations, saving time and reducing errors.
- Make Strategic Decisions: About new investments or existing portfolios.
Explore More Insights
If you’re navigating the CRE landscape, staying informed is key. Check out the previous guides in the CRE Market Movers series:
These insights, powered by Blooma and CompStak, help you make smarter, faster lending decisions.
Ready to Get Moving?
The CRE market waits for no one. Stay ahead with the insights and tools you need to make smarter, faster lending decisions. Explore how Blooma and CompStak can revolutionize your approach to CRE lending and keep you one step ahead in a volatile market.